MASTR Homestays
MASTR Homestays · Property Income Analysis

108 Satilla Ln, Warner Robins, GA 31088

Subject: 5 Bed / 3 Bath Single Family · STR Underwriting & Comp Benchmarking

🌐 www.mastrhomestays.com/
📍 Subject Property Details

Listing & Positioning

This property sits in a premium tier for Warner Robins: a 5-bedroom, 12-guest capacity single family that competes with the top of the STR market rather than typical like-for-like inventory.

🔗 View Listing
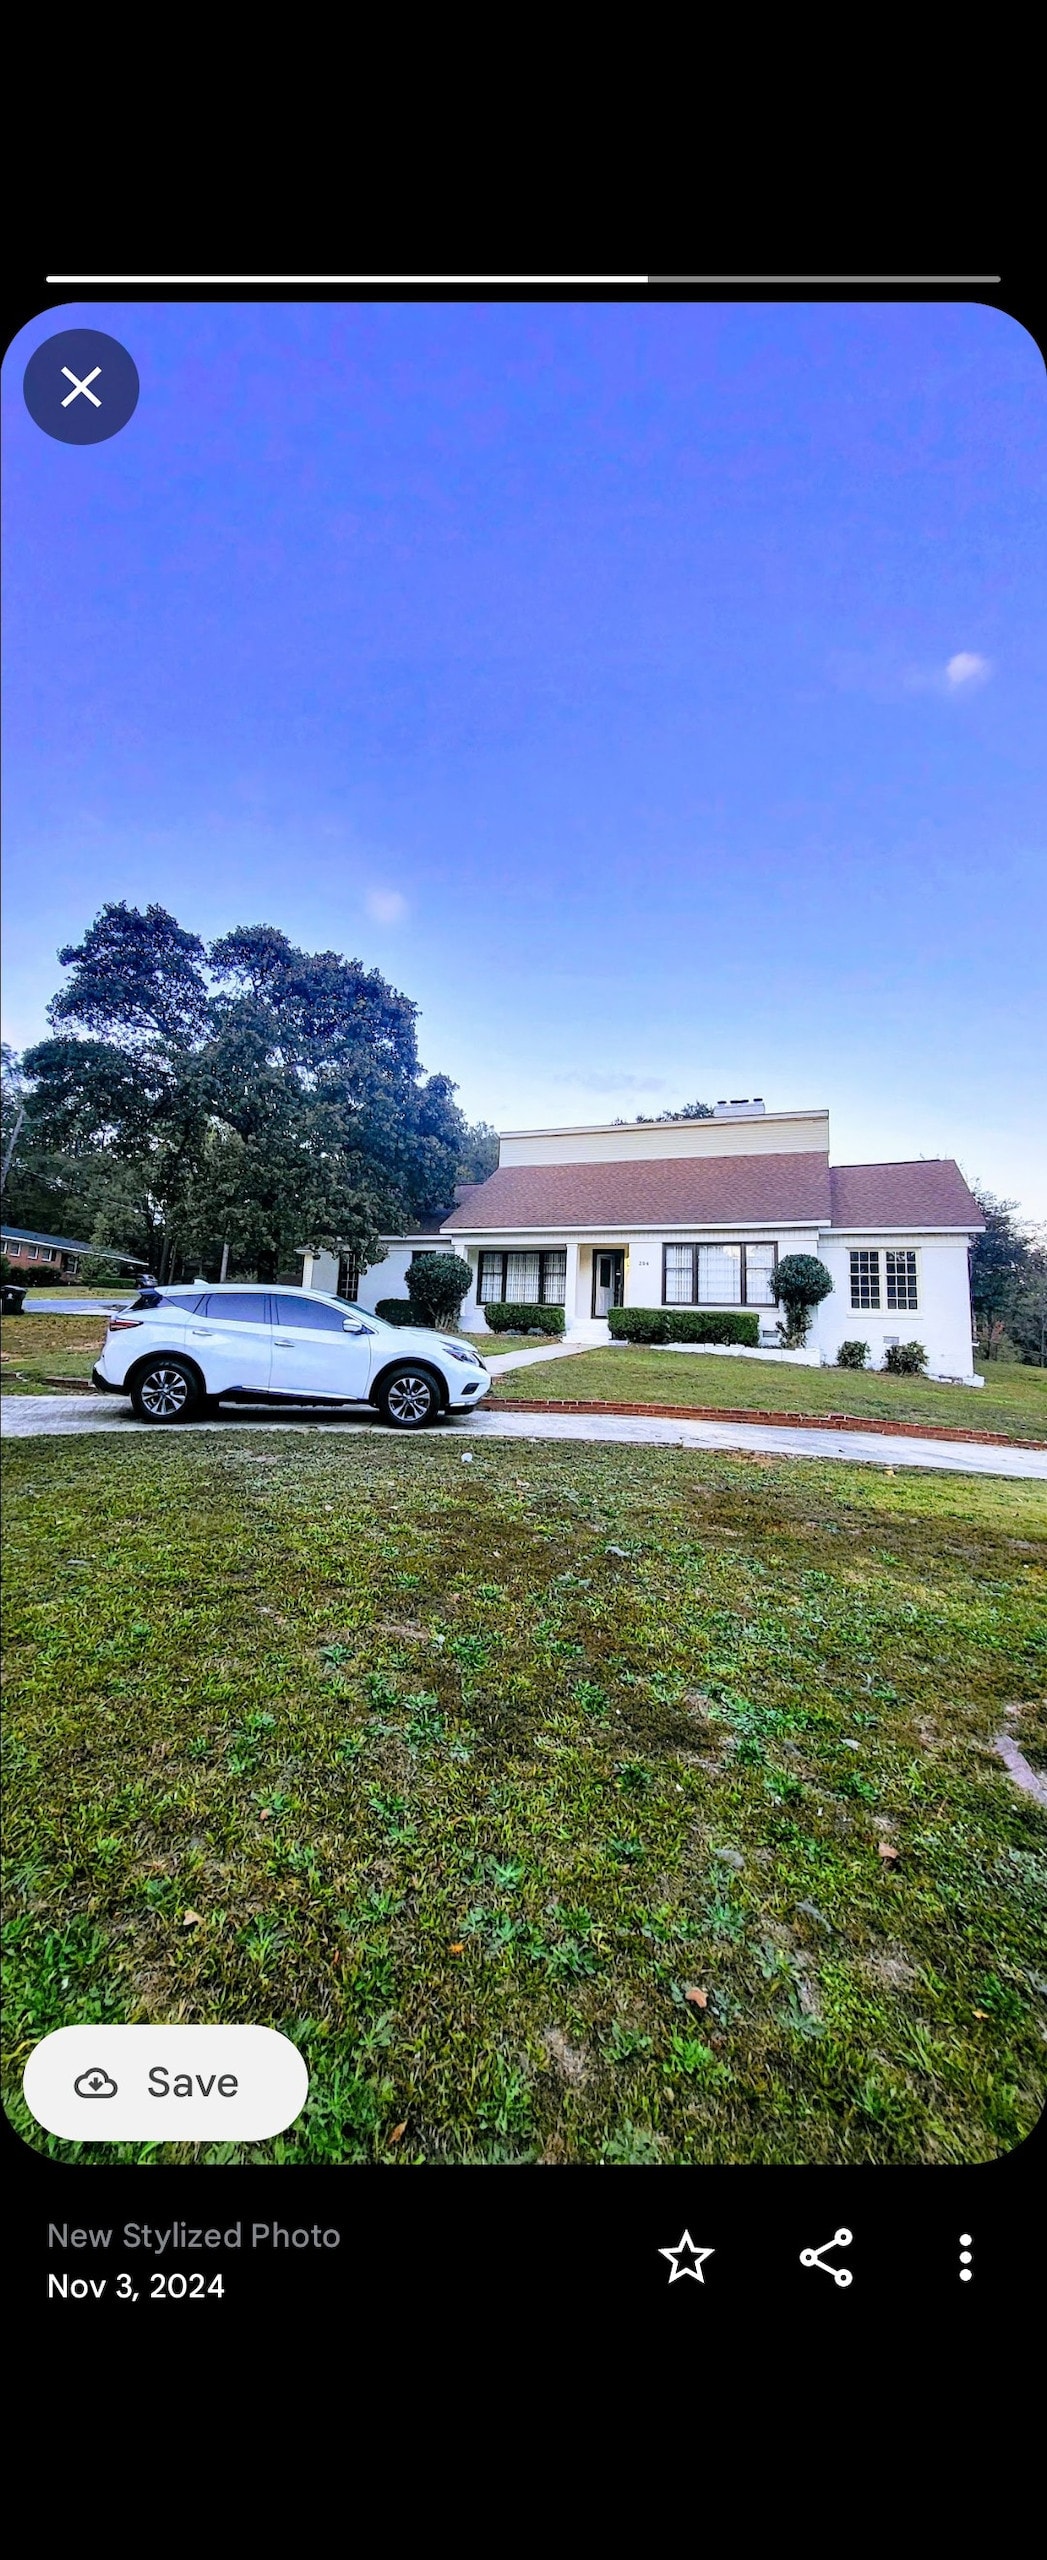
108 Satilla Ln, Warner Robins, GA 31088 hero image
Single Family
108 Satilla Ln, Warner Robins, GA 31088
5 Bedrooms · 3 Baths · 2,373 sqft
Warner Robins
View Listing →
Assumed Configuration
Single Family · 5 Bed / 3 Bath
Underwrite assumes well-presented living spaces and vacation-ready utility for Warner Robins guests.
Max Guests
12
Max guests aligned with local regulations; comp set is capped accordingly to keep pricing and demand signals comparable.
✨ Amenity Upside (Off-Season Booking Lift)
Strategic amenity investments — such as premium entertainment, outdoor living upgrades, or standout experience features — can materially improve off-season conversion. In Warner Robins, experience-driven amenities are high-impact differentiators that support stronger weekday demand and help reduce off-season vacancy.
🎮 Entertainment Upgrades 🏖️ Outdoor Living ✨ Experience Amenities 📈 Off-Season Conversion
📊 Market Positioning

Competitive Landscape & Positioning Strategy

📍
Location Premium
Prime positioning in Warner Robins places this property in the top tier of vacation rentals in the area.
Statement Quality
Premium finishes and quality presentation create a standout guest experience that commands higher nightly rates.
💰
Revenue Potential
Strong positioning supports competitive ADR and occupancy, with upside from amenity optimization and listing quality.
💰 Revenue Projections

Comp-Based Revenue Projection

Conservative
$36,608
40.0% occ · $212 ADR
Base Case
$45,772
44.0% occ · $232 ADR
Optimistic
$54,514
47.0% occ · $269 ADR
Based on trailing 12-month performance of 6 comparable properties

Interactive Performance Model

44%
Adjustable 0–100%. On average, MASTR Homestays listings run 70%+ occupancy.
$285
Comp range: $201 - $295 based on market data
365
Account for maintenance, cleaning, and personal use
Projected Annual Gross Revenue
$45,600
Based on 44% occupancy of 365 available days at $285 ADR
*Gross revenue before cleaning, platform fees, utilities, HOA/strata, taxes, supplies, and management. Actual performance may vary based on seasonality, market conditions, and operational execution.
📅 Available Nights
365
🛏️ Occupied Nights
160
💵 Revenue per Night
$285
📊 Revenue per Available Night
$124
🧮 Owner Take-Home

Estimated Net Monthly Profit

A rough after-expenses picture based on the gross revenue projected above. Move the sliders in the Interactive Performance Model to see these numbers update.

Estimated Monthly Expenses
  • Insurance$250
  • Utilities$250
  • Internet$80
  • Software$100
  • Lawncare / Pest Control$150
  • Capex (Maintenance/Repairs)$100
  • Pool Maintenance$150
  • Platform Fees (3%)$0
  • Cohost Revenue Share (15%)$0
  • Total Estimated Expenses$0
Avg. Net Monthly Profit
$0
Est. Annual Net Profit
$0
*Estimate only — excludes mortgage/rent, property taxes, HOA/strata dues, guest-facing cleaning fees, and one-time setup costs. Figures shown are standardized planning assumptions, not property-specific quotes. Actual expenses will vary.
📈 Performance Analytics

Seasonal Performance Patterns

☀️ Peak Season (Apr–Sep)
April through September is the demand peak for this market — warm-weather travel, family trips, and event weekends push both occupancy and nightly rates to their highest. Well-run listings capture the bulk of their annual revenue in these months.
🍂 Off Season (Oct–Mar)
October through March is the softer stretch, but it's also where operations make the difference. Strategic amenity positioning and listing optimization can lift off-season occupancy well above the general-market baseline and keep revenue steady year-round.
🏘️ Market Comparables

Comparable Properties (Airbnb) + AirROI Performance Snapshot

These listings represent top-performing premium homes in Warner Robins. They are the best available performance anchors, but the subject's caliber is above typical inventory — treat results as a benchmark range, with execution quality as the primary driver.
✓ AirROI Verified
5 Bedroom Pool House

5 Bedroom Pool House

AirROI

Sleeps 10 · 5 BR / 2 BA · ⭐ 4.82 (17)

🧘 Wellness ✨ Bathtub ✨ Cleaning Products
Revenue Potential
$82.9K
Annual Revenue
$53.5K
Occupancy
45%
ADR
$295
Days Available
365
Nights Booked
165
View Listing →
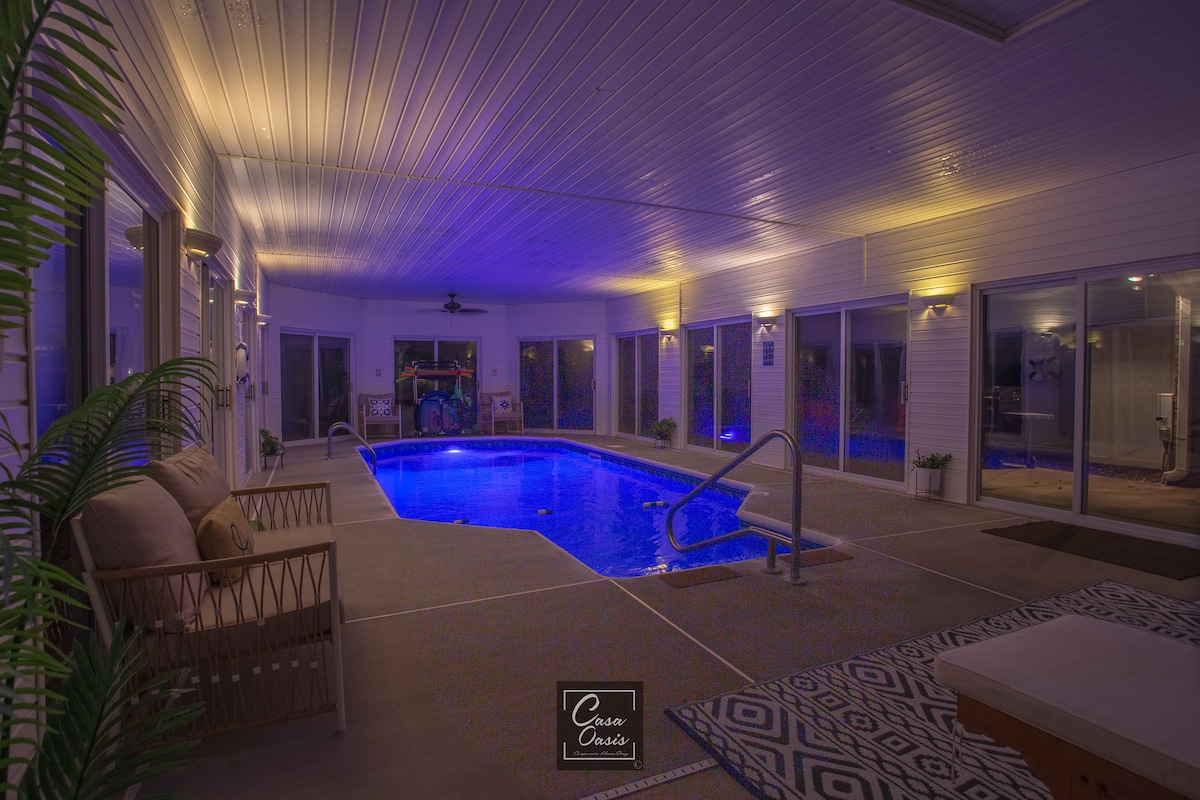
Serenity - WR Deluxe Escape w/Indoor Pool

Serenity - WR Deluxe Escape w/Indoor Pool

AirROI

Sleeps 10 · 4 BR / 2.5 BA · ⭐ 4.87 (69)

📍 Village 🧘 Wellness ✨ Luxury
Revenue Potential
$71.8K
Annual Revenue
$57.9K
Occupancy
56%
ADR
$219
Days Available
365
Nights Booked
206
View Listing →
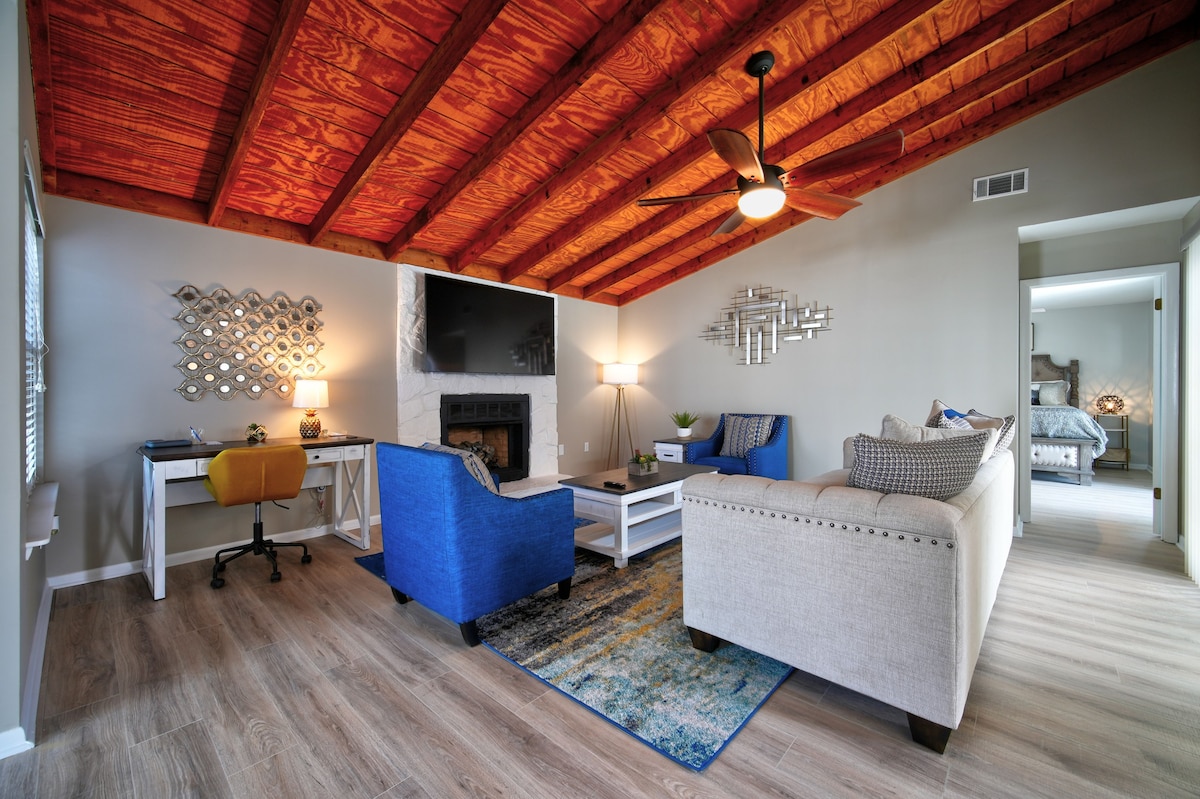
4BR | 3BTH | 7 Bed | Pool + Ping Pong + Pool table

4BR | 3BTH | 7 Bed | Pool + Ping Pong + Pool table

AirROI

Sleeps 12 · 4 BR / 3 BA · ⭐ 4.92 (24)

🔥 Fireplace 📍 Village 🧘 Wellness
Revenue Potential
$81.0K
Annual Revenue
$54.8K
Occupancy
47%
ADR
$276
Days Available
365
Nights Booked
173
View Listing →
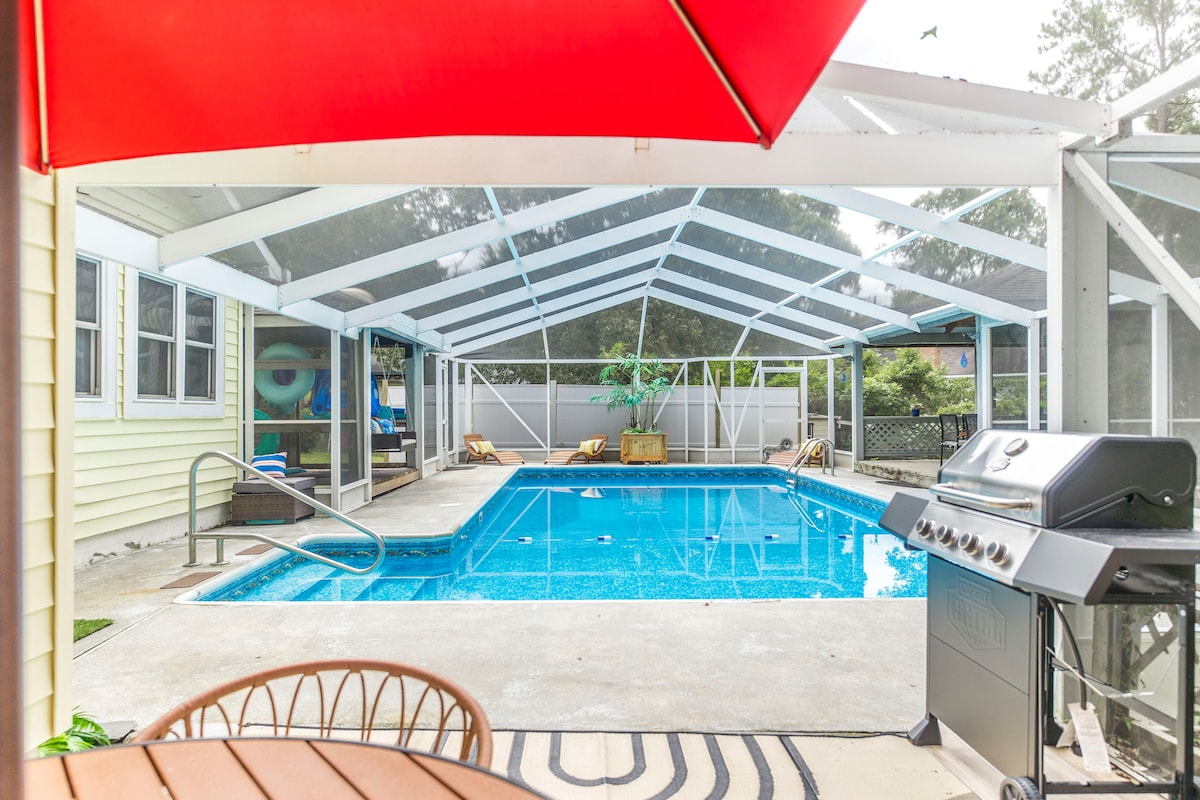
Farmhouse Estate | Screened Pool · Game · 3 Kings

Farmhouse Estate | Screened Pool · Game · 3 Kings

AirROI

Sleeps 12 · 4 BR / 4 BA · ⭐ 4.83 (12)

🧘 Wellness ✨ Luxury ✨ Hair Dryer
Revenue Potential
$50.9K
Annual Revenue
$31.1K
Occupancy
42%
ADR
$201
Days Available
334
Nights Booked
156
View Listing →
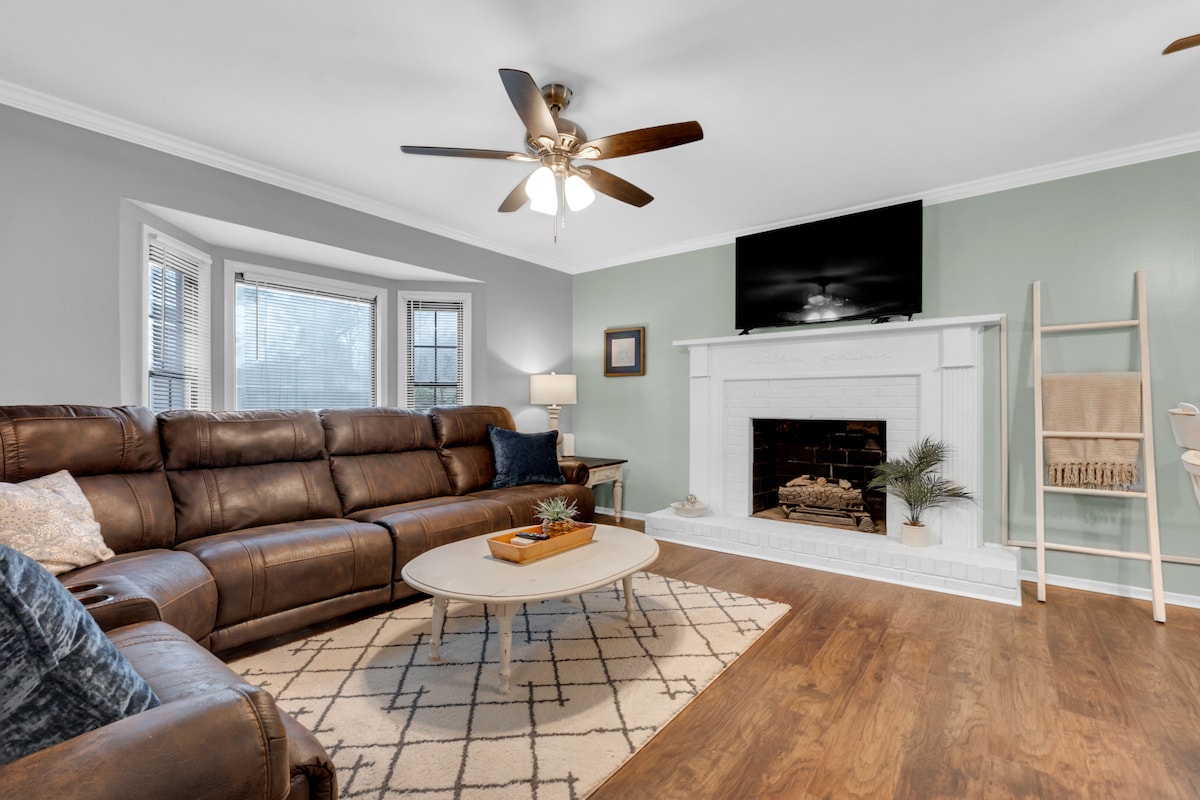
Pool Table 5 bedroom/3 bath Garage Fenced Yard

Pool Table 5 bedroom/3 bath Garage Fenced Yard

AirROI

Sleeps 12 · 5 BR / 3 BA · ⭐ 4.85 (34)

🧘 Wellness ✨ Bathtub ✨ Hair Dryer
Revenue Potential
$77.8K
Annual Revenue
$38.0K
Occupancy
34%
ADR
$244
Days Available
230
Nights Booked
125
View Listing →
Casa Azul - Blue House

Casa Azul - Blue House

AirROI

Sleeps 9 · 3 BR / 2 BA · ⭐ 4.97 (67)

🧘 Wellness ✨ Air Conditioning ✨ Pool View
Revenue Potential
$64.5K
Annual Revenue
$36.1K
Occupancy
39%
ADR
$209
Days Available
365
Nights Booked
143
View Listing →
📋 Methodology

Analysis Assumptions & Methodology

🎯 Comp Selection Criteria
  • • Premium 4-6 bedroom properties in Warner Robins
  • • Sleeps 9-12 guests (aligned with subject capacity)
  • • Active AirROI performance data (12-month trailing)
  • • Luxury tier finishes and amenities
  • • Strong review ratings (4.9+ stars)
📊 Data Sources
  • AirROI: Property-level STR revenue, ADR, and occupancy
  • Airbtics: Market-level overlay where coverage exists
  • Airbnb: Live listing data and guest reviews
  • Market Research: Warner Robins tourism trends
  • Comp Analysis: 6-category scoring engine (physical, financial, quality, amenity, reliability, must-match)
⚠️ Key Assumptions
  • • Adjustable available nights per year (100-365)
  • • Professional property management
  • • Premium photography and listing optimization
  • • Competitive dynamic pricing strategy
  • • Consistent 5-star guest experience delivery
💡 Performance Drivers
  • Peak Season (Apr–Sep): Highest demand period for Warner Robins
  • Off Season (Oct–Mar): Lower-demand months with optimization potential
  • Amenity Premium: Standout features that drive higher ADR
  • Location Premium: Proximity to attractions and points of interest
⚖️ Important Disclaimer
This analysis provides estimated gross revenue projections based on comparable property performance and market data. Actual results will vary based on operational execution, market conditions, seasonality, and property-specific factors. Revenue estimates are before all operating expenses including cleaning fees, platform commissions, utilities, property taxes, HOA/strata fees, maintenance, supplies, insurance, and management fees. Net operating income will be substantially lower after accounting for these costs. This report is for informational purposes only and should not be considered financial or investment advice.